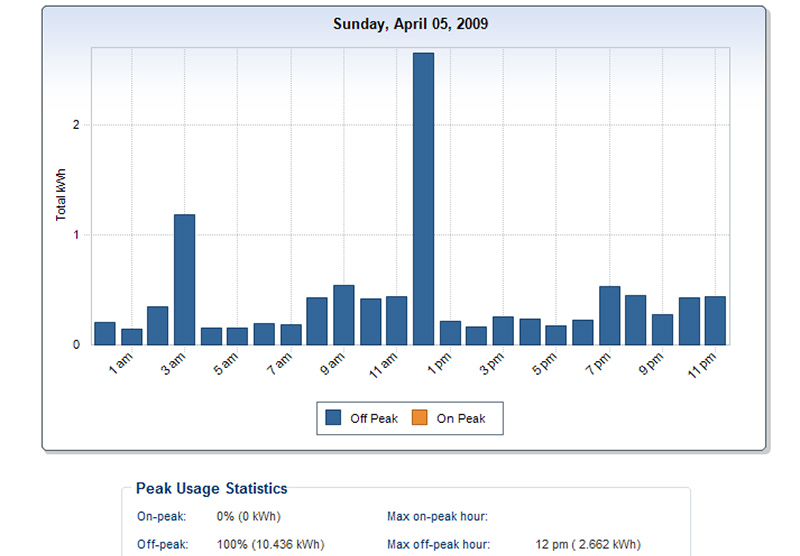
Arizona Public Service or APS as we better know our electricity provider recently did us the incredible favor of installing smart meters in our apartment complex. A smart meter allows us to see our daily and even hourly electricity usage, as soon as the following day in a browser on the internet. This fantastic service allows us to adjust our consumption on one day and see the next day how that would impact our overall usage. For example, we now know that using the dishwasher is a huge draw even without the drying cycle – back to washing dishes by hand (although this is not for certain yet as we are just today doing the dishes in the sink and will have to wait until tomorrow to see if hot water usage and the subsequent electricity usage is significantly different from going through a dishwasher cycle – I can guess we’ll see large savings).
This January we started using Windows 7 in which the sleep function for the computer now works perfectly. Compared with last year, based on usage in the middle of the night we have trimmed approximately 190 watts per hour out of our electricity usage this year. This past Friday I rewired our computers to plug our router, modem, printer, speakers, backup drive, and table lamp into a different power strip and it appears we cut another 240 watts per hour out of our usage when the power strip is switched off. With the TV, DVD player, amplifier already on a powerstrip (and turned off when not in use) we are down to 140 watts of electricity per hour overnight.
Why is this meaningful to me and hopefully you? We are presently paying $0.133 per 1,000 watts of electricity, if we can save 400 watts of electricity per hour for only 7 hours per day, we save a whopping $0.37 per day – no big deal you might say. But, over 365 days this equates to a savings of $135.93 or $11.33 per month. I figure the average family could turn off equipment that uses “Standby Power” for nearly 13 hours per day, that would be from 11:00 p.m. to 6:00 a.m. and then again from 9:00 a.m. to maybe 3:00 p.m. saving that family $0.69 per day for total savings of $252 per year or $21 per month.
Late last July our attic was given a second layer of blown-in insulation, which resulted in an immediate 25% drop in how much electricity we were using. July and August of 2008 both saw daily average temperatures of 95 degrees but our July bill dropped from 2,202 kWh of electricity used down to 1,659 kWh for August. During 2007 we averaged $7.31 per day over the 120 hottest days of summer costing us roughly $876, based on my initial estimates of saving about 25% of summer time electricity usage we will see savings this year of about $219 over those 120 days or about $18 per month as we pay on a yearly average plan. Is it economical to have a new 3-inch layer of blown-in cellulose insulation? Well, it only costs $0.20 per square foot from King Insulation in Phoenix so you can see that your savings can be terrific, especially if you plan on living in your current home for more than another year and a half. Heating over the winter has seen similar dramatic results, during the previous 3 years for our January billing cycle we used an average of 1002 kWh per month, this January we only used 623 kWh for a 38% reduction in electricity use.
To read more and to be shocked at how much electricity your appliances are using in Standby Power mode visit the Lawrence Berkeley National Laboratory webpage on Standby Power by clicking here.